Multiple Choice
The cholesterol levels for 100 adults were recorded and then displayed in the box-and-whiskers plot shown below.
a. How many adults had a cholestorol level above 212?
b. How many adults had a cholestorol level below 249?
c. How many cholestorol levels are represented in each quartile?
d. What percent of the adults had a cholestorol level of not more than 193? 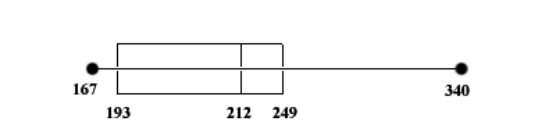
A) (a) 50 adults; (b) 75 adults; (c) 25 cholestorol levels; (d) 25
B) (a) 50 adults; (b) 25 adults; (c) 75 cholestorol levels; (d) 75
C) (a) 25 adults; (b) 75 adults; (c) 50 cholestorol levels; (d) 75
D) (a) 25 adults; (b) 75 adults; (c) 50 cholestorol levels; (d) 25
E) None of the above
Correct Answer:

Verified
Correct Answer:
Verified
Q5: A nurse monitors the blood glucose levels
Q6: The bar graph shows the increasing life
Q7: The heart rates of 24 women
Q8: The double-broken-line graph below shows the number
Q9: The circle graph shows the number of
Q11: The circle graph shows the budget allocation
Q12: A consumer research group purchased identical items
Q13: The bar graph below shows the regions
Q14: The double-broken-line graph below shows the number
Q15: The annual tuition for undergraduate college students