Multiple Choice
The bar graph below shows the regions in which all the passenger cars were produced during a recent year. What is the difference between the number of passenger cars produced in Western Europe and the number produced in Eastern Europe/Russia? 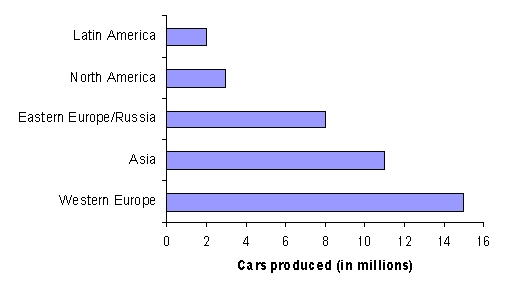
A) 9 million passenger cars
B) 23 million passenger cars
C) 7 million passenger cars
D) 11 million passenger cars
E) 24 million passenger cars
Correct Answer:

Verified
Correct Answer:
Verified
Q8: The double-broken-line graph below shows the number
Q9: The circle graph shows the number of
Q10: The cholesterol levels for 100 adults
Q11: The circle graph shows the budget allocation
Q12: A consumer research group purchased identical items
Q14: The double-broken-line graph below shows the number
Q15: The annual tuition for undergraduate college students
Q16: The pictograph below shows the approximate
Q17: The broken-line graph below shows the average
Q18: Most health statistics list normal body temperature