Multiple Choice
The circle graph shows the number of students enrolled in the various health programs offered at Southeastern Community College. What percent of the students enrolled in health programs are enrolled in the medical assisting program? Round to the nearest tenth of a percent. 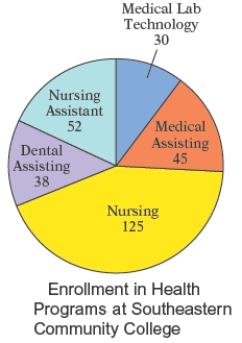
A) 14.5
B) 17.5
C) 13.5
D) 16.5
E) 15.5
Correct Answer:

Verified
Correct Answer:
Verified
Q41: The resting heart rates for a group
Q42: The frequency polygon Figure shows the approximate
Q43: An accounting major recorded the number
Q44: The annual tuition for undergraduate college students
Q45: The frequency polygon in the below
Q47: The total cholesterol readings for 40 female
Q48: The heights, in inches, of the
Q49: The circle graph shows the number
Q50: The life expectancies, in years, in
Q51: The pictograph in the following figure gives