Multiple Choice
The total cholesterol readings for 40 female patients seen this week at a doctor's office were recorded. Figure is a histogram of these data. Use the following figure. How many patients had total cholesterol readings between 500 and 600? 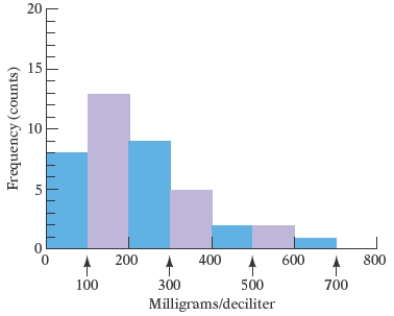
A) 4 patients
B) 3 patients
C) 2 patients
D) 5 patients
E) 6 patients
Correct Answer:

Verified
Correct Answer:
Verified
Q42: The frequency polygon Figure shows the approximate
Q43: An accounting major recorded the number
Q44: The annual tuition for undergraduate college students
Q45: The frequency polygon in the below
Q46: The circle graph shows the number
Q48: The heights, in inches, of the
Q49: The circle graph shows the number
Q50: The life expectancies, in years, in
Q51: The pictograph in the following figure gives
Q52: The double-broken-line graph shows the number of