Multiple Choice
The circle graph shows the number of blood donors of each blood type who participated in the previous blood drive at a community college. What is the ratio of donors with type A- blood to those with type O+ blood? 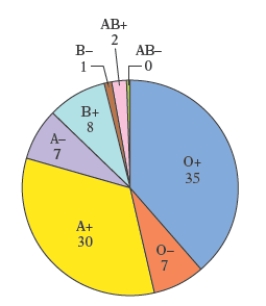
A)
B)
C)
D)
E)
Correct Answer:

Verified
Correct Answer:
Verified
Related Questions
Q44: The annual tuition for undergraduate college students
Q45: The frequency polygon in the below
Q46: The circle graph shows the number
Q47: The total cholesterol readings for 40 female
Q48: The heights, in inches, of the
Q50: The life expectancies, in years, in
Q51: The pictograph in the following figure gives
Q52: The double-broken-line graph shows the number of
Q53: The total cholesterol readings for 40 female
Q54: The circle graph shows the number