Multiple Choice
Suppose that a typical household in the United States has an average after-tax income of $38,450. The circle graph below represents how this annual income is spent. (Note: It is because of rounding that the percents do not add up to 100 .) How much more is spent on food than on entertainment? 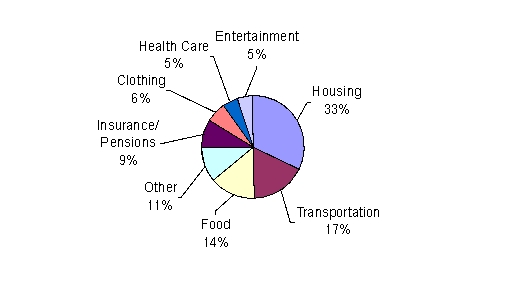
A) $34.61
B) $3460.50
C) $3360.50
D) $346.05
E) $3560.50
Correct Answer:

Verified
Correct Answer:
Verified
Q62: The number of seats occupied per flight
Q63: The broken-line graph shows the percent
Q64: The circle graph shows the budget
Q65: A nursing student at a community college
Q66: A nurse monitors the blood glucose levels
Q68: The broken-line graph shows the percent of
Q69: The number of big-screen televisions sold each
Q70: The broken-line graph below shows the average
Q71: Two dice are rolled. <br>a. What
Q72: Eight health maintenance organizations (HMOs) presented group