Multiple Choice
The circle graph shows the budget allocation for the Griner family's income. The annual family income is $125,000. What fractional amount of the budget is designated for insurance costs? 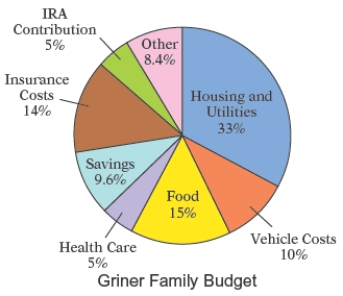
A)
B)
C)
D)
E)
Correct Answer:

Verified
Correct Answer:
Verified
Related Questions
Q59: Most health statistics list normal body
Q60: The bar graph shows the health
Q61: Of 3981 obese patients who had
Q62: The number of seats occupied per flight
Q63: The broken-line graph shows the percent
Q65: A nursing student at a community college
Q66: A nurse monitors the blood glucose levels
Q67: Suppose that a typical household in
Q68: The broken-line graph shows the percent of
Q69: The number of big-screen televisions sold each