Multiple Choice
The broken-line graph shows the percent of adults in the United States over 18 years old who took the influenza vaccine during recent years. Use the graph Between what two consecutive years was there a decrease in the percent of U.S. adults aged 18 and older taking the influenza vaccine? 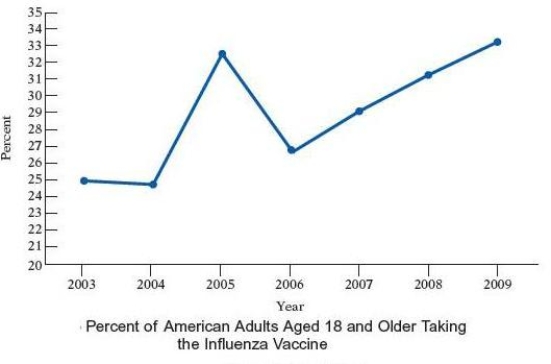
A) 2006 and 2007
B) 2005 and 2006
C) 2004 and 2005
D) 2004 and 2006
E) 2005 and 2007
Correct Answer:

Verified
Correct Answer:
Verified
Q63: The broken-line graph shows the percent
Q64: The circle graph shows the budget
Q65: A nursing student at a community college
Q66: A nurse monitors the blood glucose levels
Q67: Suppose that a typical household in
Q69: The number of big-screen televisions sold each
Q70: The broken-line graph below shows the average
Q71: Two dice are rolled. <br>a. What
Q72: Eight health maintenance organizations (HMOs) presented group
Q73: Cymbalta is a prescription medication used