Multiple Choice
The broken-line graph shows the percent of adults in the United States over 18 years old who took the influenza vaccine during recent years. Use the graph. What percent of U.S. adults aged 18 and older took the influenza vaccine in 2003? 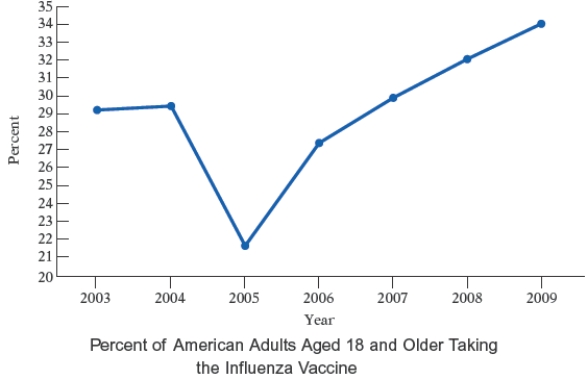
A) 29
B) 29.5
C) 28.5
D) 31
E) 27
Correct Answer:

Verified
Correct Answer:
Verified
Q14: The double-broken-line graph below shows the number
Q15: The annual tuition for undergraduate college students
Q16: The pictograph below shows the approximate
Q17: The broken-line graph below shows the average
Q18: Most health statistics list normal body temperature
Q20: A consumer research group recently reported the
Q21: The double-broken-line graph shows the number of
Q22: The bar graph shows the health occupations
Q23: The frequency polygon below shows the
Q24: A dodecahedral die has 12 sides