Multiple Choice
The broken-line graph below shows the average monthly snowfall during ski season around Aspen, Colorado. During which month is the snowfall the least? 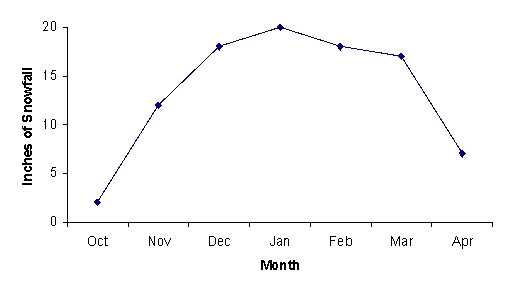
A) April
B) January
C) November
D) October
E) March
Correct Answer:

Verified
Correct Answer:
Verified
Related Questions
Q12: A consumer research group purchased identical items
Q13: The bar graph below shows the regions
Q14: The double-broken-line graph below shows the number
Q15: The annual tuition for undergraduate college students
Q16: The pictograph below shows the approximate
Q18: Most health statistics list normal body temperature
Q19: The broken-line graph shows the percent
Q20: A consumer research group recently reported the
Q21: The double-broken-line graph shows the number of
Q22: The bar graph shows the health occupations