Multiple Choice
The double-broken-line graph shows the number of Calories per day that should be consumed by women and men in various age groups. Use the following graph. People of what age and gender have the lowest recommended number of Calories? 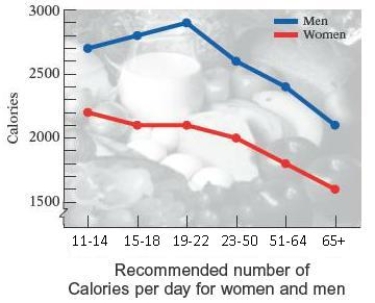
A) 70+ women
B) 75+ women
C) 60+ women
D) 65+ women
E) 80+ women
Correct Answer:

Verified
Correct Answer:
Verified
Q16: The pictograph below shows the approximate
Q17: The broken-line graph below shows the average
Q18: Most health statistics list normal body temperature
Q19: The broken-line graph shows the percent
Q20: A consumer research group recently reported the
Q22: The bar graph shows the health occupations
Q23: The frequency polygon below shows the
Q24: A dodecahedral die has 12 sides
Q25: The circle graph shows the number of
Q26: The annual tuition for undergraduate college