Multiple Choice
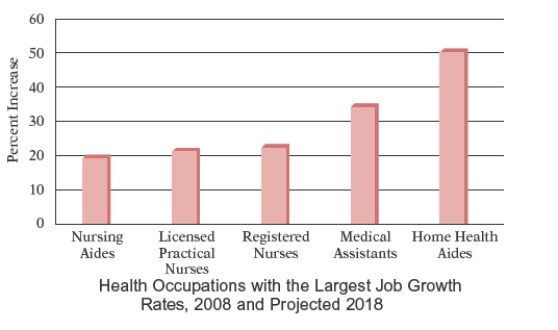
The bar graph shows the health occupations with the largest job growth 2008, and projected 2018, as reported by the U.S. Bureau of Labor Statistics. Use the graph How much higher is the predicted growth rate for Licensed Practical Nurses than the predicted growth rate for Nursing Aides? 
A) 5
B) 4
C) 7
D) 3
E) 2
Correct Answer:

Verified
Correct Answer:
Verified
Q55: The double-bar graph below shows the fuel
Q56: Most health statistics list normal body temperature
Q57: Each of the letters of the
Q58: The circle graph shows the number
Q59: Most health statistics list normal body
Q61: Of 3981 obese patients who had
Q62: The number of seats occupied per flight
Q63: The broken-line graph shows the percent
Q64: The circle graph shows the budget
Q65: A nursing student at a community college