Multiple Choice
Most health statistics list normal body temperature as 98.6°. A recent study of 30 healthy adults recorded their body temperatures at 8 A.M. and then displayed the results in the histogram in the following Figure. Use the Figure. Which class has the highest frequency? 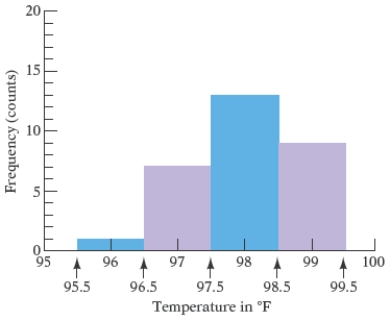
A) 96.5° to 98.5°
B) 97.5° to 98.5°
C) 96.5° to 97.5°
D) 98.5° to 99.5°
E) 95.5° to 97.5°
Correct Answer:

Verified
Correct Answer:
Verified
Q51: The pictograph in the following figure gives
Q52: The double-broken-line graph shows the number of
Q53: The total cholesterol readings for 40 female
Q54: The circle graph shows the number
Q55: The double-bar graph below shows the fuel
Q57: Each of the letters of the
Q58: The circle graph shows the number
Q59: Most health statistics list normal body
Q60: The bar graph shows the health
Q61: Of 3981 obese patients who had