Multiple Choice
The following schematic graph shows the result of two quantitative RT-PCR experiments. Total mRNA from two tissue samples (1 and 2) was isolated and subjected to RT-PCR using primers designed to amplify a tissue-specific gene. Added to the reaction was a fluorescent dye that fluoresces only when bound to double-stranded DNA. According to the graph, which tissue has a higher level of this mRNA? By how much? 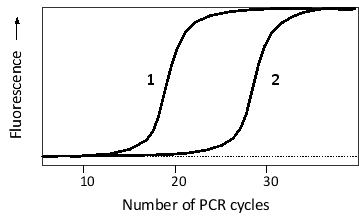
A) About 2-fold higher in tissue 1
B) About 1000-fold higher in tissue 1
C) About 2-fold higher in tissue 2
D) About 1000-fold higher in tissue 2
Correct Answer:

Verified
Correct Answer:
Verified
Q76: Your friend has cut a 3000-nucleotide-pair circular
Q77: A piece of DNA has been sequenced
Q78: You have devised genetic screens to identify
Q79: When a promoter p is not saturated
Q80: A pool of five barcoded yeast mutants,
Q82: The schematic graph below represents the nullclines
Q83: For a complementation test to work, the
Q84: The results of two sets of chromatin
Q85: A piece of DNA has been sequenced
Q86: Sort the following cellular components to reflect