Multiple Choice
Consider a transcription regulatory protein (A) that can bind to the promoter (p) of a target gene. After reaching an initial steady state, the concentration of A is suddenly increased tenfold. The following graph shows the formation of A:p over time after this change. What is the slope of the curve at time zero? 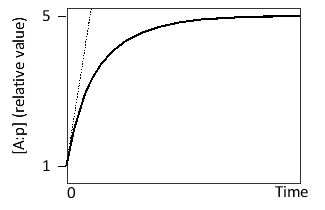
A) 2 kₒff
B) 2 kₒn
C) 5 kₒff
D) 5 kₒn
E) 9 kₒff
Correct Answer:

Verified
Correct Answer:
Verified
Q47: You have used fluorescence-activated cell sorting to
Q48: If two genomic polymorphic sites were randomly
Q49: You have discovered a mutant protein that
Q50: Consider the transcriptional circuits depicted in the
Q51: The quantitative output of a gene depends
Q53: You mated male and female heterozygous Oct4
Q54: Indicate whether each of the following better
Q55: Which of the following chromatography methods resembles
Q56: Imagine a bistable system composed of two
Q57: Bacterial artificial chromosomes (BACs) …<br>A) are derived