Multiple Choice
The quantitative output of a gene depends in part on the relative affinities of transcription regulators. In the following graphs, the red color indicates high gene expression and blue color indicates low gene expression. The expression level is plotted as a function of the concentrations of two transcription regulatory proteins, an activator (A) and a repressor (R) . Every other parameter being identical, which graph corresponds to a system where the affinity of protein A for the cis?-regulatory sequences is higher than that of protein R? Which graph corresponds to a system that shows a "leakier" expression? 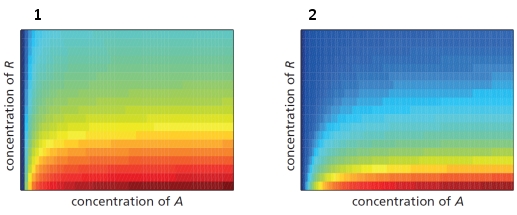
A) Graph 1; Graph 1
B) Graph 1; Graph 2
C) Graph 2; Graph 1
D) Graph 2; Graph 2
Correct Answer:

Verified
Correct Answer:
Verified
Q46: Indicate whether ordinary agarose-gel electrophoresis (A), polyacrylamide-gel
Q47: You have used fluorescence-activated cell sorting to
Q48: If two genomic polymorphic sites were randomly
Q49: You have discovered a mutant protein that
Q50: Consider the transcriptional circuits depicted in the
Q52: Consider a transcription regulatory protein (A) that
Q53: You mated male and female heterozygous Oct4
Q54: Indicate whether each of the following better
Q55: Which of the following chromatography methods resembles
Q56: Imagine a bistable system composed of two