Multiple Choice
Bistability in a biological system can be accompanied by hysteresis. Consider switchlike cellular responses to a signal molecule, as shown in the following graphs. In each graph, the solid curve corresponds to the change in cellular response when the signal concentration is being increased over time, whereas the dashed curve corresponds to the change when the signal concentration is being decreased. Which graph do you think corresponds to a system with a greater degree of hysteresis? What mechanism is responsible for this behavior? 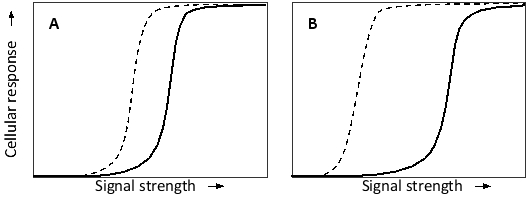
A) Graph A; negative feedback
B) Graph A; positive feedback
C) Graph B; negative feedback
D) Graph B; positive feedback
Correct Answer:

Verified
Correct Answer:
Verified
Q67: Two loci on a human chromosome are
Q68: Fill in the blank in the following
Q69: Indicate whether each of the following descriptions
Q70: Indicate whether each of the following manipulations
Q71: Consider two proteins A and B with
Q73: You have carried out a genetic screen
Q74: Everything else being equal, if the mean
Q75: Indicate whether each of the following descriptions
Q76: Your friend has cut a 3000-nucleotide-pair circular
Q77: A piece of DNA has been sequenced