Multiple Choice
The following pictograph shows the number of bicyclists who participated in the Labor Day weekend bicycle race for the
years 2003-2009. Use the graph to answer the question. 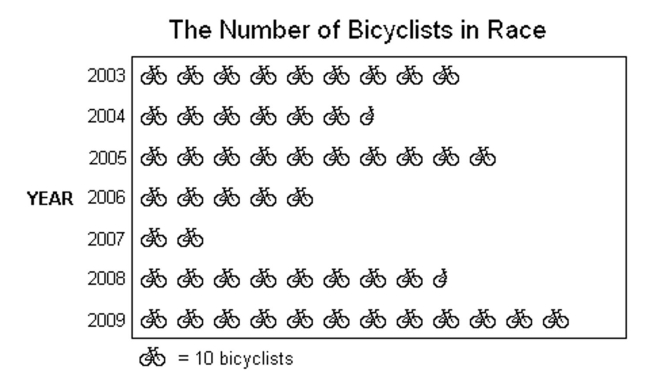
-In what years was there an increase in the number of cyclists who participated in the race?
A) 2003, 2005, 2009
B) 2004, 2005, 2009
C) 2004, 2006, 2007
D) 2005, 2008, 2009
Correct Answer:

Verified
Correct Answer:
Verified
Q41: Find the mean. If necessary, round to
Q42: Fill in the blank with one
Q43: Find the mean, median, and mode of
Q44: The bar graph shows the number of
Q45: The circle graph shows the results of
Q47: Find the mean. If necessary, round to
Q48: Find the mode or modes (if any).<br>-20,
Q49: Find the mean. If necessary, round to
Q50: Find the median. If necessary, round to
Q51: Find the probability of the event