Multiple Choice
The circle graph shows the results of the student council presidential election. The complete circular area represents 100%
of the votes.
-Student Council President 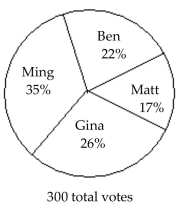 The circle graph shows what percent of the vote each person received. What percent of the votes did Matt and Ben receive together?
A) 22%
B) 39%
C) 61%
D) 17%
Correct Answer:

Verified
Correct Answer:
Verified
Q40: The histogram shows the scores of each
Q41: Find the mean. If necessary, round to
Q42: Fill in the blank with one
Q43: Find the mean, median, and mode of
Q44: The bar graph shows the number of
Q46: The following pictograph shows the number of
Q47: Find the mean. If necessary, round to
Q48: Find the mode or modes (if any).<br>-20,
Q49: Find the mean. If necessary, round to
Q50: Find the median. If necessary, round to