Multiple Choice
The bar graph shows the number of tickets sold each week by the garden club for their annual flower show. 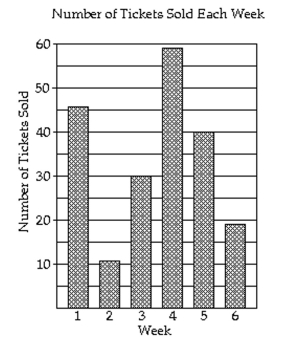
-How many more tickets were sold during week 6 than week 2?
A) 30 tickets
B) 13 tickets
C) 8 tickets
D) 18 tickets
Correct Answer:

Verified
Correct Answer:
Verified
Related Questions
Q39: Twenty teenagers were asked to give
Q40: The histogram shows the scores of each
Q41: Find the mean. If necessary, round to
Q42: Fill in the blank with one
Q43: Find the mean, median, and mode of
Q45: The circle graph shows the results of
Q46: The following pictograph shows the number of
Q47: Find the mean. If necessary, round to
Q48: Find the mode or modes (if any).<br>-20,
Q49: Find the mean. If necessary, round to