Multiple Choice
The bar graph shows the number of tickets sold each week by the garden club for their annual flower show. 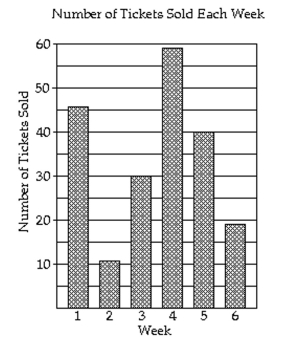
-How many tickets were sold during week 5?
A) 40 tickets
B) 46 tickets
C) 19 tickets
D) 11 tickets
Correct Answer:

Verified
Correct Answer:
Verified
Related Questions
Q109: Twenty teenagers were asked to give
Q110: Find the probability of the event
Q111: The line graph shows the recorded hourly
Q112: The following pictograph shows the number of
Q113: Find the mode or modes (if any).<br>-1.5,
Q115: Find the mean. If necessary, round to
Q116: The circle graph shows the results
Q117: The following pictograph shows the number of
Q118: Fill in the blank with one
Q119: Find the probability of the event.<br>-If