Multiple Choice
The circle graph shows the results of the student council presidential election. The complete circular area represents 100%
of the votes.
-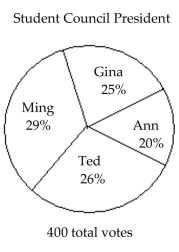 The circle graph shows what percent of the vote each person received. Find the ratio of Ann's votes to Gina's votes.
A)
B)
C)
D)
Correct Answer:

Verified
Correct Answer:
Verified
Related Questions
Q111: The line graph shows the recorded hourly
Q112: The following pictograph shows the number of
Q113: Find the mode or modes (if any).<br>-1.5,
Q114: The bar graph shows the number of
Q115: Find the mean. If necessary, round to
Q117: The following pictograph shows the number of
Q118: Fill in the blank with one
Q119: Find the probability of the event.<br>-If
Q120: Find the probability of the event
Q121: Find the median. If necessary, round to