Multiple Choice
The line graph shows the recorded hourly temperatures in degrees Fahrenheit at an airport. 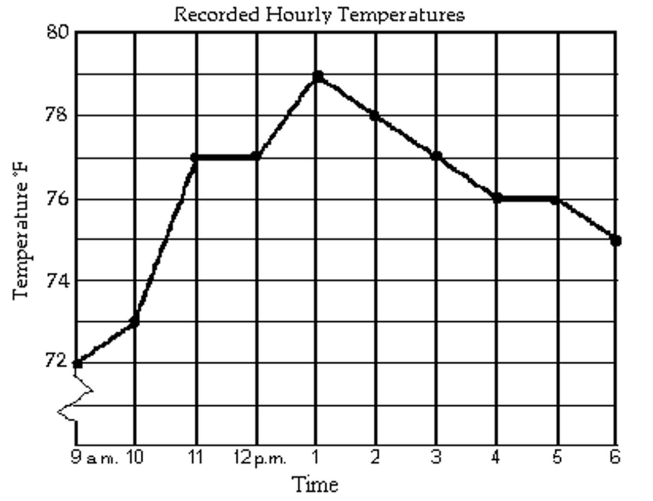
-During which hours shown was the temperature greater than 76°F?
A) 10 a.m. to 3 p.m.
B) 11 a.m. to 3 p.m.
C) 11 a.m. to 5 p.m.
D) 10 a.m. to 5 p.m.
Correct Answer:

Verified
Correct Answer:
Verified
Related Questions
Q106: Find the probability of the event.<br>-If
Q107: Find the mode or modes (if any).<br>-5,
Q108: Find the probability of the event.<br>-If
Q109: Twenty teenagers were asked to give
Q110: Find the probability of the event
Q112: The following pictograph shows the number of
Q113: Find the mode or modes (if any).<br>-1.5,
Q114: The bar graph shows the number of
Q115: Find the mean. If necessary, round to
Q116: The circle graph shows the results