Multiple Choice
The circle graph shows the results of the student council presidential election. The complete circular area represents 100%
of the votes.
-Student Council President 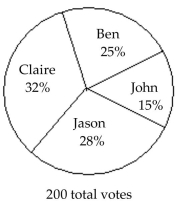 The circle graph shows what percent of the vote each person received. What percent of the votes did Ben NOT get?
A) 72%
B) 25%
C) 75%
D) 68%
Correct Answer:

Verified
Correct Answer:
Verified
Related Questions
Q11: Find the probability of the event
Q12: The following circle graph displays Chris
Q13: The bar graph shows the number of
Q14: Fill in the blank with one
Q15: The pictograph shows the number of bicycles
Q17: The bar graph shows the number of
Q18: Find the median. If necessary, round to
Q19: The bar graph shows the expenditures of
Q20: Solve. If necessary, round answers to the
Q21: Find the mean, median, and mode of