Multiple Choice
The following circle graph displays Chris and Mary Smith's monthly $2900 family budget. Use the circle graph to answer
the question. 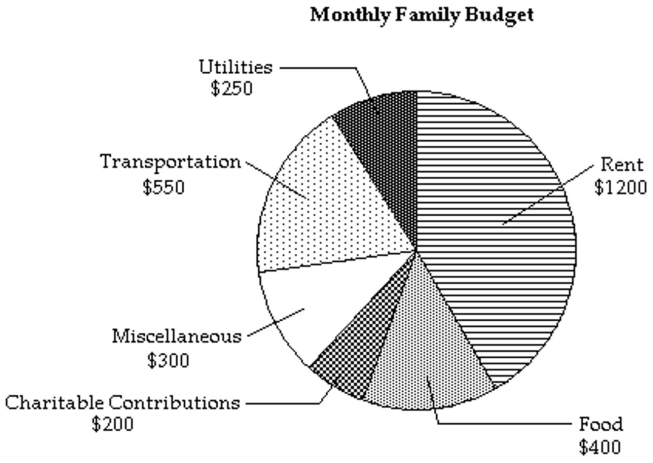
-What is the ratio of money spent on food to money spent on utilities?
A)
B)
C)
D)
Correct Answer:

Verified
Correct Answer:
Verified
Related Questions
Q7: The line graph shows the recorded hourly
Q8: The line graph shows the recorded hourly
Q9: The circle graph shows the results of
Q10: The circle graph summarizes the results
Q11: Find the probability of the event
Q13: The bar graph shows the number of
Q14: Fill in the blank with one
Q15: The pictograph shows the number of bicycles
Q16: The circle graph shows the results of
Q17: The bar graph shows the number of