Multiple Choice
The bar graph shows the number of students who flunk Dr. Jones' class each year. 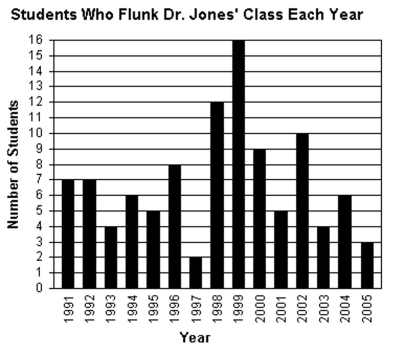
-During which year did Dr. Jones' have the fewest number of students flunk his class? How many students flunked during that year?
A) 2005, 2 students
B) 1999, 16 students
C) 2005, 3 students
D) 1997, 2 students
Correct Answer:

Verified
Correct Answer:
Verified
Related Questions
Q8: The line graph shows the recorded hourly
Q9: The circle graph shows the results of
Q10: The circle graph summarizes the results
Q11: Find the probability of the event
Q12: The following circle graph displays Chris
Q14: Fill in the blank with one
Q15: The pictograph shows the number of bicycles
Q16: The circle graph shows the results of
Q17: The bar graph shows the number of
Q18: Find the median. If necessary, round to