Multiple Choice
For the table below, calculate the percent of students that fell within the B class. 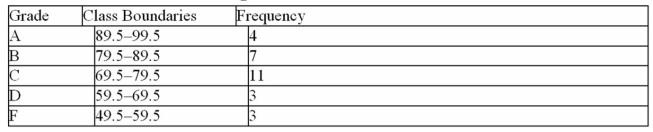
A) 14%
B) 25%
C) 11%
D) 39%
Correct Answer:

Verified
Correct Answer:
Verified
Related Questions
Q5: Karen is constructing a pie graph to
Q7: <img src="https://d2lvgg3v3hfg70.cloudfront.net/TB8376/.jpg" alt=" What type of
Q8: The total frequency of the data whose
Q11: What is the lower class limit in
Q24: When the range is large, and classes
Q26: Thirty students recorded the colours of their
Q32: For the class 16.3-23.8, the width is
Q42: The three most commonly used graphs in
Q47: Graphs give a visual representation that enables
Q65: What would be the boundaries on the