Multiple Choice
The graph below shows the percentage of students enrolled in the College of Engineering at State University. Use the
graph to answer the question. 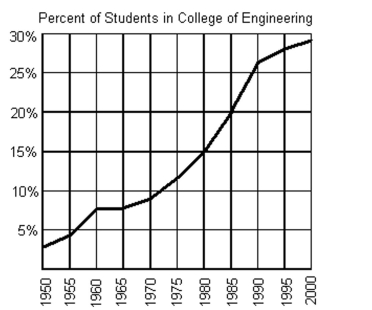
-Between what two years is the difference in function values equal to 5%?
A) between 1985 and 1990
B) between 1960 and 1965
C) between 1970 and 1975
D) between 1980 and 1985
Correct Answer:

Verified
Correct Answer:
Verified
Q8: Solve the problem.<br>-The graph shows the projected
Q9: Express in set builder notation the set
Q10: Illustrate the set on a number line.<br>-<img
Q11: Graph the linear function by plotting the
Q12: The graph below shows the percentage of
Q14: Find the equation of a line with
Q15: Provide an appropriate response.<br>-The set of y-coordinates
Q16: Solve the problem.<br>-Linda needs to have her
Q17: Evaluate the function for the indicated value.<br>-<img
Q18: Graph the equation.<br>-<img src="https://d2lvgg3v3hfg70.cloudfront.net/TB8475/.jpg" alt="Graph the equation.