Multiple Choice
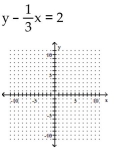
Graph the linear function by plotting the x- and y-intercepts.
-
A) 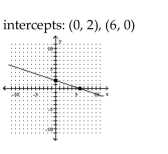
B) 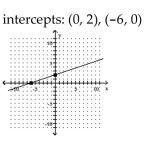
C) 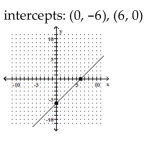
D) 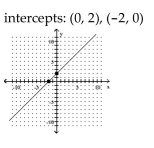
Correct Answer:

Verified
Correct Answer:
Verified
Related Questions
Q6: Write the equation in standard form.<br>-y -
Q7: Two points on L1 and two points
Q8: Solve the problem.<br>-The graph shows the projected
Q9: Express in set builder notation the set
Q10: Illustrate the set on a number line.<br>-<img
Q12: The graph below shows the percentage of
Q13: The graph below shows the percentage of
Q14: Find the equation of a line with
Q15: Provide an appropriate response.<br>-The set of y-coordinates
Q16: Solve the problem.<br>-Linda needs to have her