Multiple Choice
Solve the problem.
-The graph shows the projected radio sales (in millions) for a particular company. 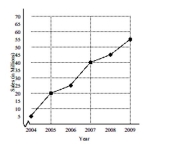 Determine the slope of the line segment from 2004 to 2005.
A) 5
B) 20
C) 10
D) 15
Correct Answer:

Verified
Correct Answer:
Verified
Related Questions
Q3: Evaluate the function for the indicated value.<br>-<img
Q4: Solve the problem.<br>-The formula for the area
Q5: Solve the problem.<br>-Sue and Bob have each
Q6: Write the equation in standard form.<br>-y -
Q7: Two points on L1 and two points
Q9: Express in set builder notation the set
Q10: Illustrate the set on a number line.<br>-<img
Q11: Graph the linear function by plotting the
Q12: The graph below shows the percentage of
Q13: The graph below shows the percentage of