Multiple Choice
Solve the problem.
-Sue and Bob have each saved money during every year from 2000 to 2005. The following bar graph shows the amounts saved each of those years. 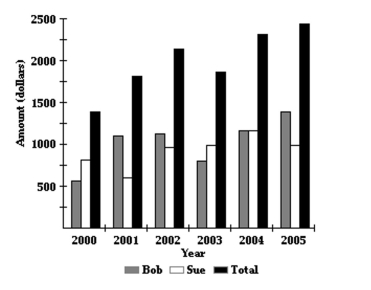 In what years did Bob save more than the previous year, but Sue save less than the previous year?
A) 2001 and 2004
B) 2002 and 2004
C) 2001 and 2005
D) 2004 and 2005
Correct Answer:

Verified
Correct Answer:
Verified
Q1: Solve the problem.<br>-The average value , V,
Q2: Solve the problem.<br>-The price of commodities, like
Q3: Evaluate the function for the indicated value.<br>-<img
Q4: Solve the problem.<br>-The formula for the area
Q6: Write the equation in standard form.<br>-y -
Q7: Two points on L1 and two points
Q8: Solve the problem.<br>-The graph shows the projected
Q9: Express in set builder notation the set
Q10: Illustrate the set on a number line.<br>-<img
Q11: Graph the linear function by plotting the