Related Questions
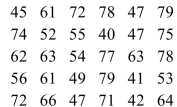
Q48: Construct a stem and leaf plot for
Q49: A data set of size 21 has
Q50: Find the equation of the regression line.
Q51: Draw a bar graph illustrating the change
Q52: Find the value for the correlation coefficient
Q54: Assume a data set is normally distributed
Q55: Find the value for r and test
Q56: Fifty 10-year-olds were monitored to determine the
Q57: To obtain the frequency distribution below, twenty-three
Q58: For the following data<br>(a)Draw a scatter plot.<br>(b)Find