Essay
Fifty 10-year-olds were monitored to determine the number of hours per week they spent watching
television, surfing the net, and playing video games. The results were used to obtain the frequency
distribution below. Construct a histogram and frequency polygon for the data. 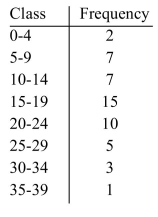
Correct Answer:

Verified
Correct Answer:
Verified
Q51: Draw a bar graph illustrating the change
Q52: Find the value for the correlation coefficient
Q53: Construct a stem leaf plot for the
Q54: Assume a data set is normally distributed
Q55: Find the value for r and test
Q57: To obtain the frequency distribution below, twenty-three
Q58: For the following data<br>(a)Draw a scatter plot.<br>(b)Find
Q59: Suppose that the mean sale price for
Q60: A researcher is studying possible grade inflation
Q61: Normal distributions are very commonly used for