Essay
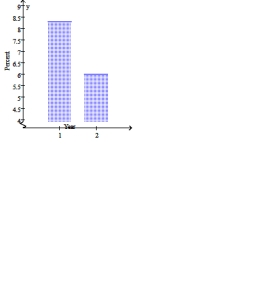
Draw a bar graph illustrating the change in a state's tax rate on each of the axes below. Note that
you'll be using the same information on each graph. 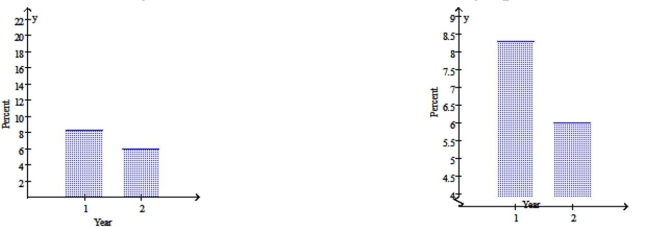
 \
\
Which of the two bar graphs would be used by someone wanting to argue that this tax cut won't hurt the state's
budget much? Why?
Correct Answer:

Verified
The graph on the left makes it...View Answer
Unlock this answer now
Get Access to more Verified Answers free of charge
Correct Answer:
Verified
View Answer
Unlock this answer now
Get Access to more Verified Answers free of charge
Q46: Consider the survey question "Do you feel
Q47: Find the area under the normal distribution
Q48: Construct a stem and leaf plot for
Q49: A data set of size 21 has
Q50: Find the equation of the regression line.
Q52: Find the value for the correlation coefficient
Q53: Construct a stem leaf plot for the
Q54: Assume a data set is normally distributed
Q55: Find the value for r and test
Q56: Fifty 10-year-olds were monitored to determine the