Essay
The frequency distribution below was obtained by monitoring the number of vacation days per year
taken by twenty-five employees. Construct a histogram and frequency polygon for the data. 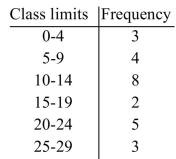
Correct Answer:

Verified
Correct Answer:
Verified
Related Questions
Q13: If a data value has a Z
Q14: Find the equation of the regression line.
Q15: If a student scored 1,484 on the
Q16: A bookstore recorded the type of books
Q17: Find the variance and standard deviation. <img
Q19: Assume that males have a mean height
Q20: The exam grades of 31 students were
Q21: The graphs below display the average life
Q22: Fifty people participated in a poll to
Q23: Find the range, variance, and standard deviation