Essay
Fifty people participated in a poll to determine their favorite ice cream flavor. Use the data to
construct a pie chart. 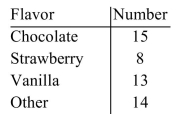
Correct Answer:

Verified
Correct Answer:
Verified
Related Questions
Q17: Find the variance and standard deviation. <img
Q18: The frequency distribution below was obtained by
Q19: Assume that males have a mean height
Q20: The exam grades of 31 students were
Q21: The graphs below display the average life
Q23: Find the range, variance, and standard deviation
Q24: Based on data compiled by the World
Q25: Find the area under the normal distribution
Q26: Use the box plot to fill in
Q27: An aptitude test has a mean of