Essay
The graphs below display the average life expectancy for Americans according to the National
Center for Health Statistics. Which graph would you show if you were arguing that we're really not
living much longer than we were way, way back in 1985? 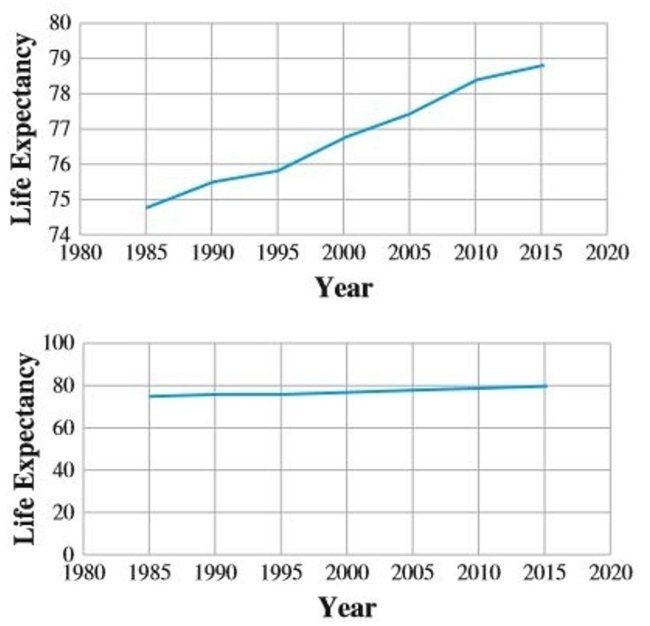
Correct Answer:

Verified
The second. With tha...View Answer
Unlock this answer now
Get Access to more Verified Answers free of charge
Correct Answer:
Verified
View Answer
Unlock this answer now
Get Access to more Verified Answers free of charge
Q16: A bookstore recorded the type of books
Q17: Find the variance and standard deviation. <img
Q18: The frequency distribution below was obtained by
Q19: Assume that males have a mean height
Q20: The exam grades of 31 students were
Q22: Fifty people participated in a poll to
Q23: Find the range, variance, and standard deviation
Q24: Based on data compiled by the World
Q25: Find the area under the normal distribution
Q26: Use the box plot to fill in