Multiple Choice
Find the range, variance, and standard deviation for the given data. The table below shows the
Average points scored per game by several intramural softball teams. Round to one decimal place. 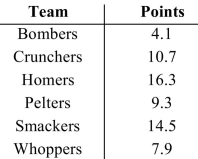
A) range: 10.2, variance: 16.5, standard deviation: 4.1
B) range: 12.2, variance: 16.5, standard deviation: 4.1
C) range: 12.2, variance: 19.8, standard deviation: 4.4
D) range: 10.2, variance: 19.8, standard deviation: 4.4
Correct Answer:

Verified
Correct Answer:
Verified
Q103: These data represent the grades on a
Q104: Draw a scatter plot and describe the
Q105: Consider the survey question "Are you going
Q106: The average amount customers at a certain
Q107: Last year's total attendance at Long Run
Q109: Determine whether a correlation coefficient of r
Q110: A standardized test of intelligence is scaled
Q111: A sample is one where members of
Q112: Find the area under the normal distribution
Q113: These data represent the number of gas