Short Answer
These data represent the grades on a college exam. Find the mean 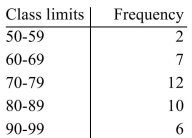
Correct Answer:

Verified
Correct Answer:
Verified
Related Questions
Q98: Use a scatter plot to determine the
Q99: The chance that a person will be
Q100: A that's large relative to the mean
Q101: Draw a scatter plot and describe the
Q102: The average amount customers at a certain
Q104: Draw a scatter plot and describe the
Q105: Consider the survey question "Are you going
Q106: The average amount customers at a certain
Q107: Last year's total attendance at Long Run
Q108: Find the range, variance, and standard deviation