Essay
Draw a scatter plot and describe the relationship. 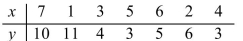
Correct Answer:

Verified
A nonlinea...View Answer
Unlock this answer now
Get Access to more Verified Answers free of charge
Correct Answer:
Verified
A nonlinea...
View Answer
Unlock this answer now
Get Access to more Verified Answers free of charge
Related Questions
Q96: Assume a data set is normally distributed
Q97: The average number of students in a
Q98: Use a scatter plot to determine the
Q99: The chance that a person will be
Q100: A that's large relative to the mean
Q102: The average amount customers at a certain
Q103: These data represent the grades on a
Q104: Draw a scatter plot and describe the
Q105: Consider the survey question "Are you going
Q106: The average amount customers at a certain