Multiple Choice
Use a scatter plot to determine the relationship between the x values and the y values. 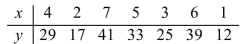
A) Nonlinear relationship
B) Negative linear relationship
C) No relationship
D) Positive linear relationship
Correct Answer:

Verified
Correct Answer:
Verified
Related Questions
Q93: If a student's rank in a class
Q94: Find the equation of the regression line
Q95: A recent study showed that eating garlic
Q96: Assume a data set is normally distributed
Q97: The average number of students in a
Q99: The chance that a person will be
Q100: A that's large relative to the mean
Q101: Draw a scatter plot and describe the
Q102: The average amount customers at a certain
Q103: These data represent the grades on a