Essay
Forty truck buyers were asked to indicate the car dealer they believed offered the best overall service. The four choices were A, B, C, and D as shown below: 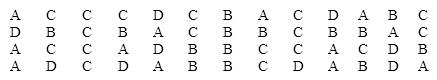 Construct a table showing the frequencies and relative frequencies for this data set. What proportion of car buyers rated dealer D as the best?
Correct Answer:

Verified
Correct Answer:
Verified
Q1: Business School Graduates A sample of business
Q4: Car Buyers Forty car buyers were asked
Q5: If we draw a straight line through
Q6: Business School Graduates A sample of business
Q7: Data for calories and salt content (milligrams
Q8: According to the stem-and-leaf plot below, this
Q10: Electronics Company At a meeting of regional
Q25: Bar and pie charts are graphical techniques
Q90: A bar chart is used to represent
Q102: If the data in a scatter diagram