Multiple Choice
Exhibit 30-1 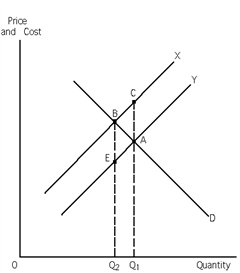
Refer to Exhibit 30-1. This graph represents a negative externality situation. Given this, which of the two curves, X or Y, represents marginal social costs and why?
A) Curve X, because if there is a negative externality, external costs are associated with it: social costs = external costs + private costs, therefore the marginal social cost curve must lie above the marginal private cost curve.
B) Curve Y, because if there is a negative externality, negative external costs are associated with it: social costs = negative external costs + private costs, therefore the marginal social cost curve must lie below the marginal private cost curve.
C) Curve X, because if there is a negative externality, external benefits are associated with it: social costs = external benefits + private costs, therefore the marginal social cost curve must lie above the marginal private cost curve.
D) Curve Y, because if there is a negative externality, negative external benefits are associated with it: social costs = negative external benefits + private costs, therefore the marginal social cost curve must lie below the marginal private cost curve.
Correct Answer:

Verified
Correct Answer:
Verified
Q2: A nonexcludable public good is characterized by
Q4: Exhibit 30-2 <br><img src="https://d2lvgg3v3hfg70.cloudfront.net/TBX9059/.jpg" alt="Exhibit 30-2
Q5: Exhibit 30-3 <img src="https://d2lvgg3v3hfg70.cloudfront.net/TBX9059/.jpg" alt="Exhibit 30-3
Q6: The disagreement between A. C. Pigou and
Q10: A positive externality is internalized when<br>A)demand shifts
Q53: A side effect of an action that
Q68: A negative externality exists and government wants
Q116: The primary difference between private goods and
Q149: There are two divorce laws, A and
Q184: According to the Coase theorem, externalities<br>A)must usually