Multiple Choice
The figure below shows the short-run aggregate demand and supply curves of an economy. If the economy is currently producing at Y2, long-run equilibrium will most likely be established by a(n) :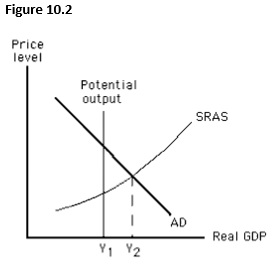
A) increase in short-run aggregate supply.
B) decrease in short-run aggregate supply.
C) decrease in potential output.
D) increase in potential output.
E) rightward shift of the aggregate demand curve.
Correct Answer:

Verified
Correct Answer:
Verified
Q22: Which of the following occurs when an
Q50: During a particular year,nominal wages increased by
Q73: The potential output of an economy is
Q78: Consider schedule #1 in the aggregate demand
Q80: The figure given below depicts long-run equilibrium
Q81: At the potential level of output,there is
Q84: The figure below shows the short-run aggregate
Q95: The capital stock of an economy increases:<br>A)whenever
Q128: The more the short-run output exceeds an
Q147: An increase in the federal minimum wage