Multiple Choice
The figure below shows the short-run aggregate demand and supply curves of an economy. In this figure, the distance between Y1 and Y2 represents: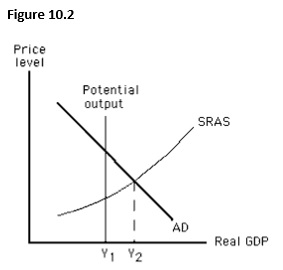
A) an expansionary gap.
B) a recessionary gap.
C) a cost-push inflation.
D) the natural rate of unemployment.
E) the full employment output.
Correct Answer:

Verified
Correct Answer:
Verified
Q16: Which of the following is true when
Q22: Which of the following occurs when an
Q50: During a particular year,nominal wages increased by
Q73: The potential output of an economy is
Q80: The figure given below depicts long-run equilibrium
Q82: The figure below shows the short-run aggregate
Q95: The capital stock of an economy increases:<br>A)whenever
Q125: Which of these is not assumed to
Q128: The more the short-run output exceeds an
Q147: An increase in the federal minimum wage