Multiple Choice
The figure given below depicts long-run equilibrium in the aggregate demand-aggregate supply model. The movement from Y1 to Y2 in this figure could have been caused by a: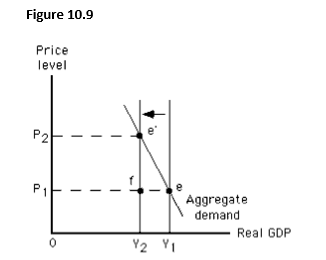
A) decrease in the size of the labor force.
B) decrease in the price level.
C) positive level of net investment.
D) increase in autonomous consumption.
E) decrease in autonomous consumption.
Correct Answer:

Verified
Correct Answer:
Verified
Q8: If the actual price level is less
Q22: Which of the following occurs when an
Q50: During a particular year,nominal wages increased by
Q71: The long run is the period of
Q78: Consider schedule #1 in the aggregate demand
Q81: At the potential level of output,there is
Q82: The figure below shows the short-run aggregate
Q84: The figure below shows the short-run aggregate
Q128: The more the short-run output exceeds an
Q147: An increase in the federal minimum wage