Multiple Choice
The graph shown depicts which of the following? 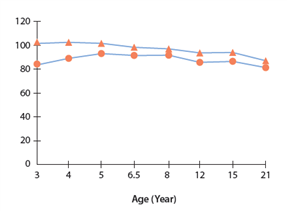
A) reading scores and math scores of Head Start children
B) achievement scores of boys (top) and girls (bottom) in Head Start
C) IQ scores of children in the Abecedarian group (upper line) and in Head Start (lower line)
D) IQ scores of children in the Abecedarian group and in a control group
Correct Answer:

Verified
Correct Answer:
Verified
Q2: Samuel, who is 12, lives with both
Q3: What happens to the positive effects of
Q4: When two things, orks and lopas, are
Q5: Selena has loved sports from the time
Q6: A researcher wants to find out whether
Q7: When scientists say that siblings share 50%
Q8: A researcher wishes to investigate how students
Q9: Why do Japanese schools prefer large classes?<br>A)
Q10: By the time a well-designed longitudinal study
Q11: Consider the story of Olly Neal, who