Multiple Choice
Use the figure below to answer the following question(s) . Figure 4-7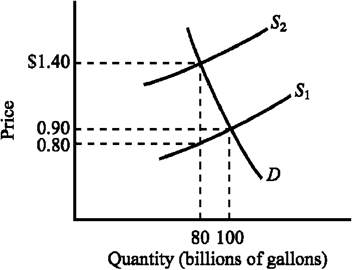 Refer to Figure 4-7. The supply curve S1 and the demand curve D indicate initial conditions in the market for gasoline. A $.60-per-gallon excise tax on gasoline is levied. How much revenue does the $.60-per-gallon tax generate for the government?
A) $40 billion
B) $48 billion
C) $50 billion
D) $60 billion
Correct Answer:

Verified
Correct Answer:
Verified
Q98: Figure 4-22 <img src="https://d2lvgg3v3hfg70.cloudfront.net/TBX9063/.jpg" alt="Figure 4-22
Q100: Figure 4-24 <img src="https://d2lvgg3v3hfg70.cloudfront.net/TBX9063/.jpg" alt="Figure 4-24
Q102: Use the table below to choose the
Q103: Figure 4-23 <img src="https://d2lvgg3v3hfg70.cloudfront.net/TBX9063/.jpg" alt="Figure 4-23
Q106: Figure 4-17 <img src="https://d2lvgg3v3hfg70.cloudfront.net/TBX9063/.jpg" alt="Figure 4-17
Q146: The burden of a tax will fall
Q162: The actual incidence (or burden) of a
Q178: When a government subsidy is granted to
Q185: When a government subsidy is granted to
Q239: A subsidy on a product will generate