Essay
You are a manager in the Sales department for a clothing store that has three locations. You have prepared the following worksheet containing data about the sales figures for the company, which also has a chart of the data. 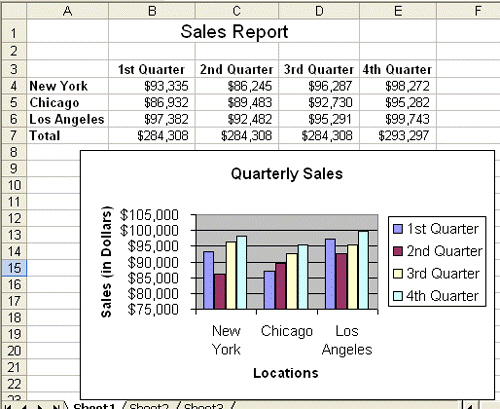 Which store location had the highest sales in the 2nd Quarter? Which had the lowest sales in the same quarter?
Correct Answer:

Verified
Los Angeles had the ...View Answer
Unlock this answer now
Get Access to more Verified Answers free of charge
Correct Answer:
Verified
View Answer
Unlock this answer now
Get Access to more Verified Answers free of charge
Q3: <img src="https://d2lvgg3v3hfg70.cloudfront.net/TBX9074/.jpg" alt=" As shown in
Q7: You can modify the data range and
Q9: A chart must be located in a
Q10: <img src="https://d2lvgg3v3hfg70.cloudfront.net/TBX9074/.jpg" alt=" As shown in
Q11: <img src="https://d2lvgg3v3hfg70.cloudfront.net/TBX9074/.jpg" alt=" The arrows shown
Q19: A scatter chart _.<br>A) compares distinct, unrelated
Q212: WordArt, which lets you create curved or
Q216: A collection of related data points is
Q261: On a chart created in Excel, the
Q407: Each value in a cell selected for