Short Answer
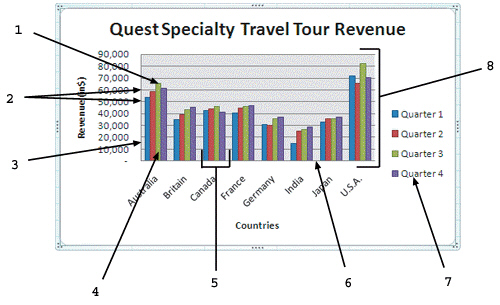 As shown in the figure above, item 2 points to ____________________.
Correct Answer:

Verified
Correct Answer:
Verified
Related Questions
Q6: You are a manager in the Sales
Q7: You can modify the data range and
Q9: A chart must be located in a
Q10: <img src="https://d2lvgg3v3hfg70.cloudfront.net/TBX9074/.jpg" alt=" As shown in
Q11: <img src="https://d2lvgg3v3hfg70.cloudfront.net/TBX9074/.jpg" alt=" The arrows shown
Q19: A scatter chart _.<br>A) compares distinct, unrelated
Q212: WordArt, which lets you create curved or
Q216: A collection of related data points is
Q261: On a chart created in Excel, the
Q407: Each value in a cell selected for